

In the realm of artificial intelligence and multi-agent systems, understanding how agents experience and navigate their environments is crucial for developing more sophisticated models. A fascinating approach to this challenge involves embedding agent states into vector spaces and analyzing the resulting patterns. This article explores our recent findings on how embedding techniques can reveal insights about agent behavior diversity and experiential richness.
The Embedding Approach
Our research leveraged text embedding models to convert agent state data into high-dimensional vectors. These embeddings capture the semantic relationships between different states that an agent experiences during simulation. We then used t-SNE (t-distributed Stochastic Neighbor Embedding) to visualize these high-dimensional embeddings in a 2D space, revealing clusters and patterns that would otherwise remain hidden.
The embedding process weighted different state variables based on their importance:
context_weights = {
    'position_x': 3.0,
    'position_y': 3.0,
    'resource_level': 1.0,
    'current_health': 0.8,
    'agent_id': 5.0,
}
This weighting scheme ensured that spatial information (the agent's position) had significant influence on the resulting embeddings, while still accounting for other important state variables.
Visualizing Agent State Embeddings
When we visualized the embeddings of multiple agents' states, we observed a striking pattern: some agents displayed tightly clustered embeddings, while others showed much more dispersed patterns across the embedding space.
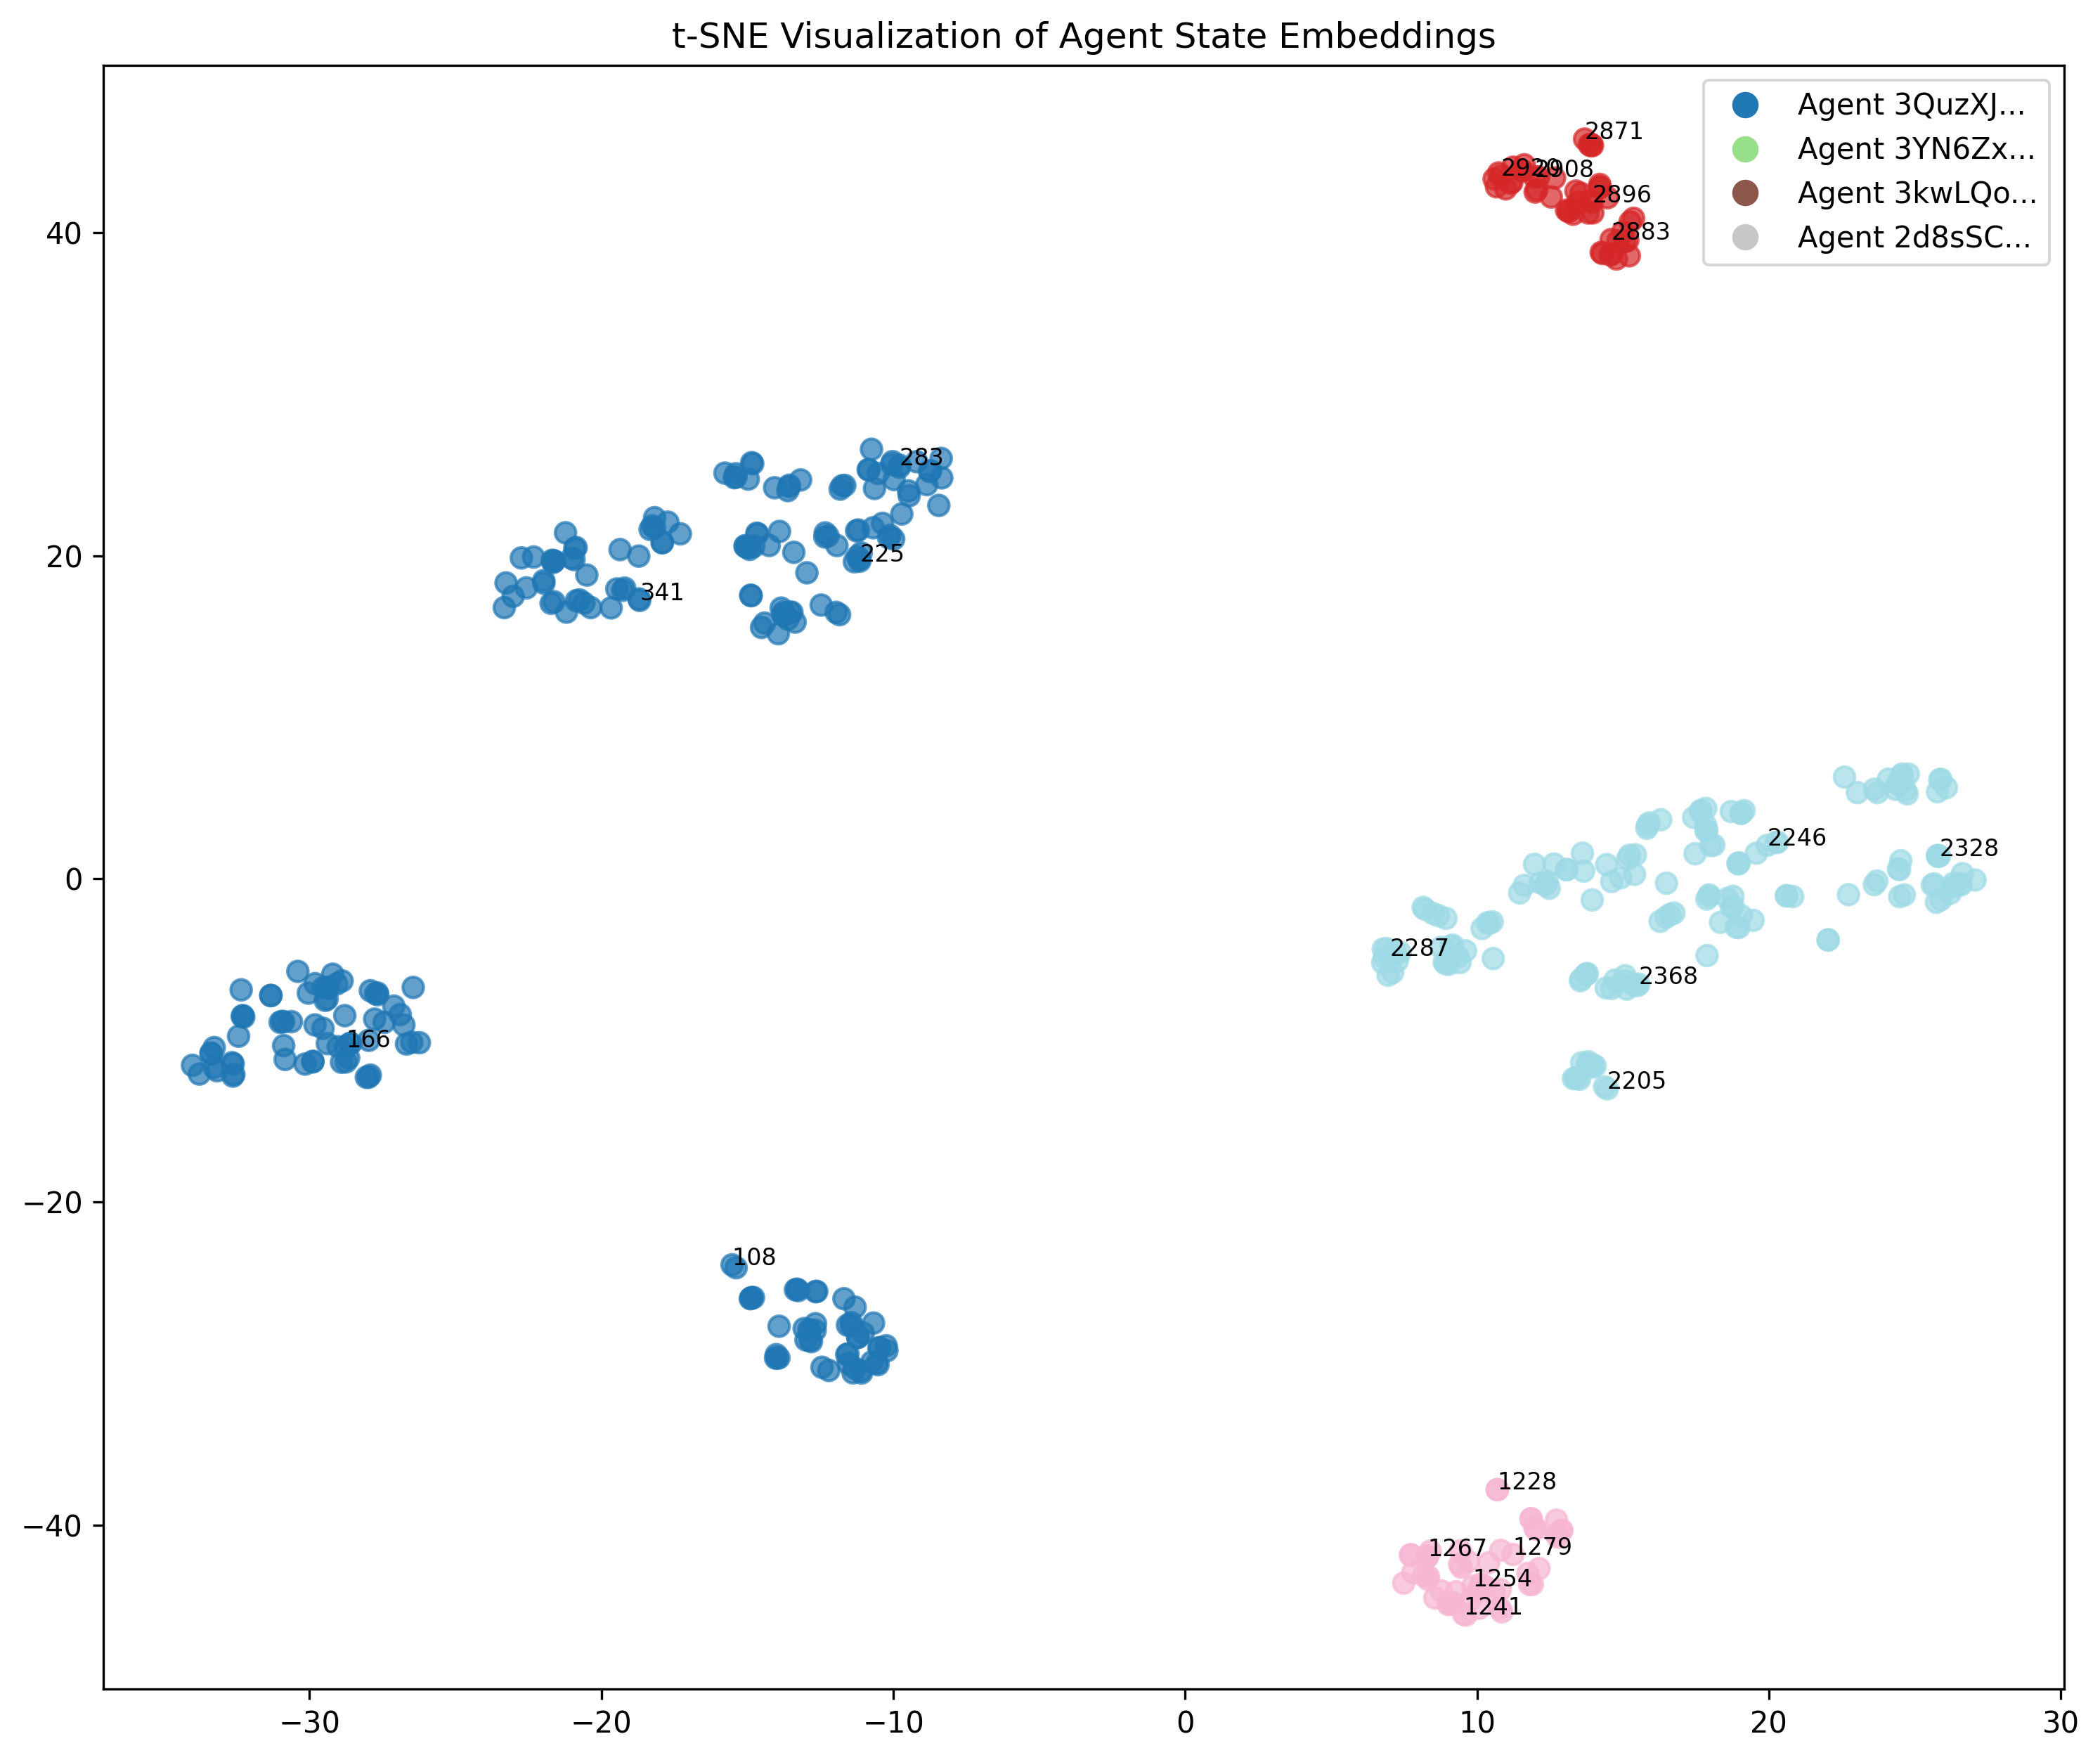
In the visualization above, each point represents a state from an agent's experience, with colors indicating different agents. The light-colored agent (Agent 2d8sSC...) exhibits significantly more spread across the embedding space compared to other agents, whose states form more compact clusters.
Multi-Cluster Patterns in Agent Embeddings
While examining the embedding visualization, we observed another fascinating phenomenon: the blue agent (Agent 3QuzXJ...) forms several distinct clusters rather than a single continuous region in the embedding space. This agent appears in four separate clusters with distinct step numbers (108, 166, 341, 325) visible in different regions.
This multi-cluster pattern indicates that the agent experienced distinct behavioral phases during its lifecycle. Each cluster represents a different period when the agent was operating in a distinct area of the environment or engaged in a specific behavioral mode. The numbered steps visible in each cluster confirm this temporal progression through different states.
The separation between clusters suggests significant transitions in the agent's state—movements to entirely new regions of the environment or shifts in its operational parameters that caused dramatic changes in its state representation. Unlike agents with continuous spreads (suggesting gradual exploration) or tight clusters (suggesting limited exploration), this multi-cluster pattern reveals an agent that made discrete jumps between different behavioral regimes.
This finding highlights how embedding visualizations can reveal not just the extent of an agent's experiential diversity but also the structure of that diversity—whether exploration occurred continuously or through discrete phases of activity in different regions.
Interpreting Agent Clusters: A Case Study
To better understand what each cluster in the blue agent's embedding represents, we conducted a detailed analysis of the agent's state data at key points identified in the visualization. By examining position coordinates, resource levels, and health values at the timesteps corresponding to each cluster (steps 108, 166, 325, 341), we identified distinctive phases in the agent's operation:
Cluster 1: Initial Resource-Rich Exploration (Around Step 108)
This cluster represents the agent's early exploration phase, characterized by:
Position: (54.9, 58.1) - Eastern region of the environment
Resource Level: 5.0 (high)
Health: 100.0 (optimal)
During this phase, the agent was in a resource-rich area with optimal health conditions, representing its initial exploration strategy.
Cluster 2: Western Border Operation (Around Step 166)
The second cluster shows a dramatic transition:
Position: (0.0, 66.1) - Extreme western edge of the environment
Resource Level: 3.82 (moderate decline)
Health: 99.62 (slight decrease)
This cluster represents an entirely different behavioral mode where the agent moved to the western border, possibly following a resource gradient or responding to environmental pressure.
Cluster 3: Northern Border Resource Depletion (Around Step 325)
The third cluster shows another significant shift:
Position: (0.0, 100.0) - Northwestern corner of the environment
Resource Level: 0.47 (critically low)
Health: 98.18 (declining)
This phase represents a resource-depleted state in the northernmost region, suggesting the agent reached an environmental boundary while experiencing resource scarcity.
Cluster 4: Adaptive Response (Around Step 341)
The final cluster reveals a slight position adjustment:
Position: (8.0, 100.0) - Small eastward movement along northern edge
Resource Level: -1.96 (full depletion)
Health: 98.17 (continued decline)
This cluster represents an adaptive response to resource depletion, with the agent making a lateral move along the northern boundary, possibly attempting to find new resources.
This case study demonstrates how embedding clusters directly correspond to meaningful behavioral states and transitions. The stark separation between clusters in embedding space accurately reflects significant transitions in physical position and resource conditions, validating the embedding method's sensitivity to meaningful state changes.
Investigating the Spread Phenomenon
To understand why certain agents displayed more dispersion in the embedding space, we conducted a detailed analysis of their state variables and movement patterns.
Position Traces Analysis
First, we plotted the position traces of agents with the highest and lowest position ranges:
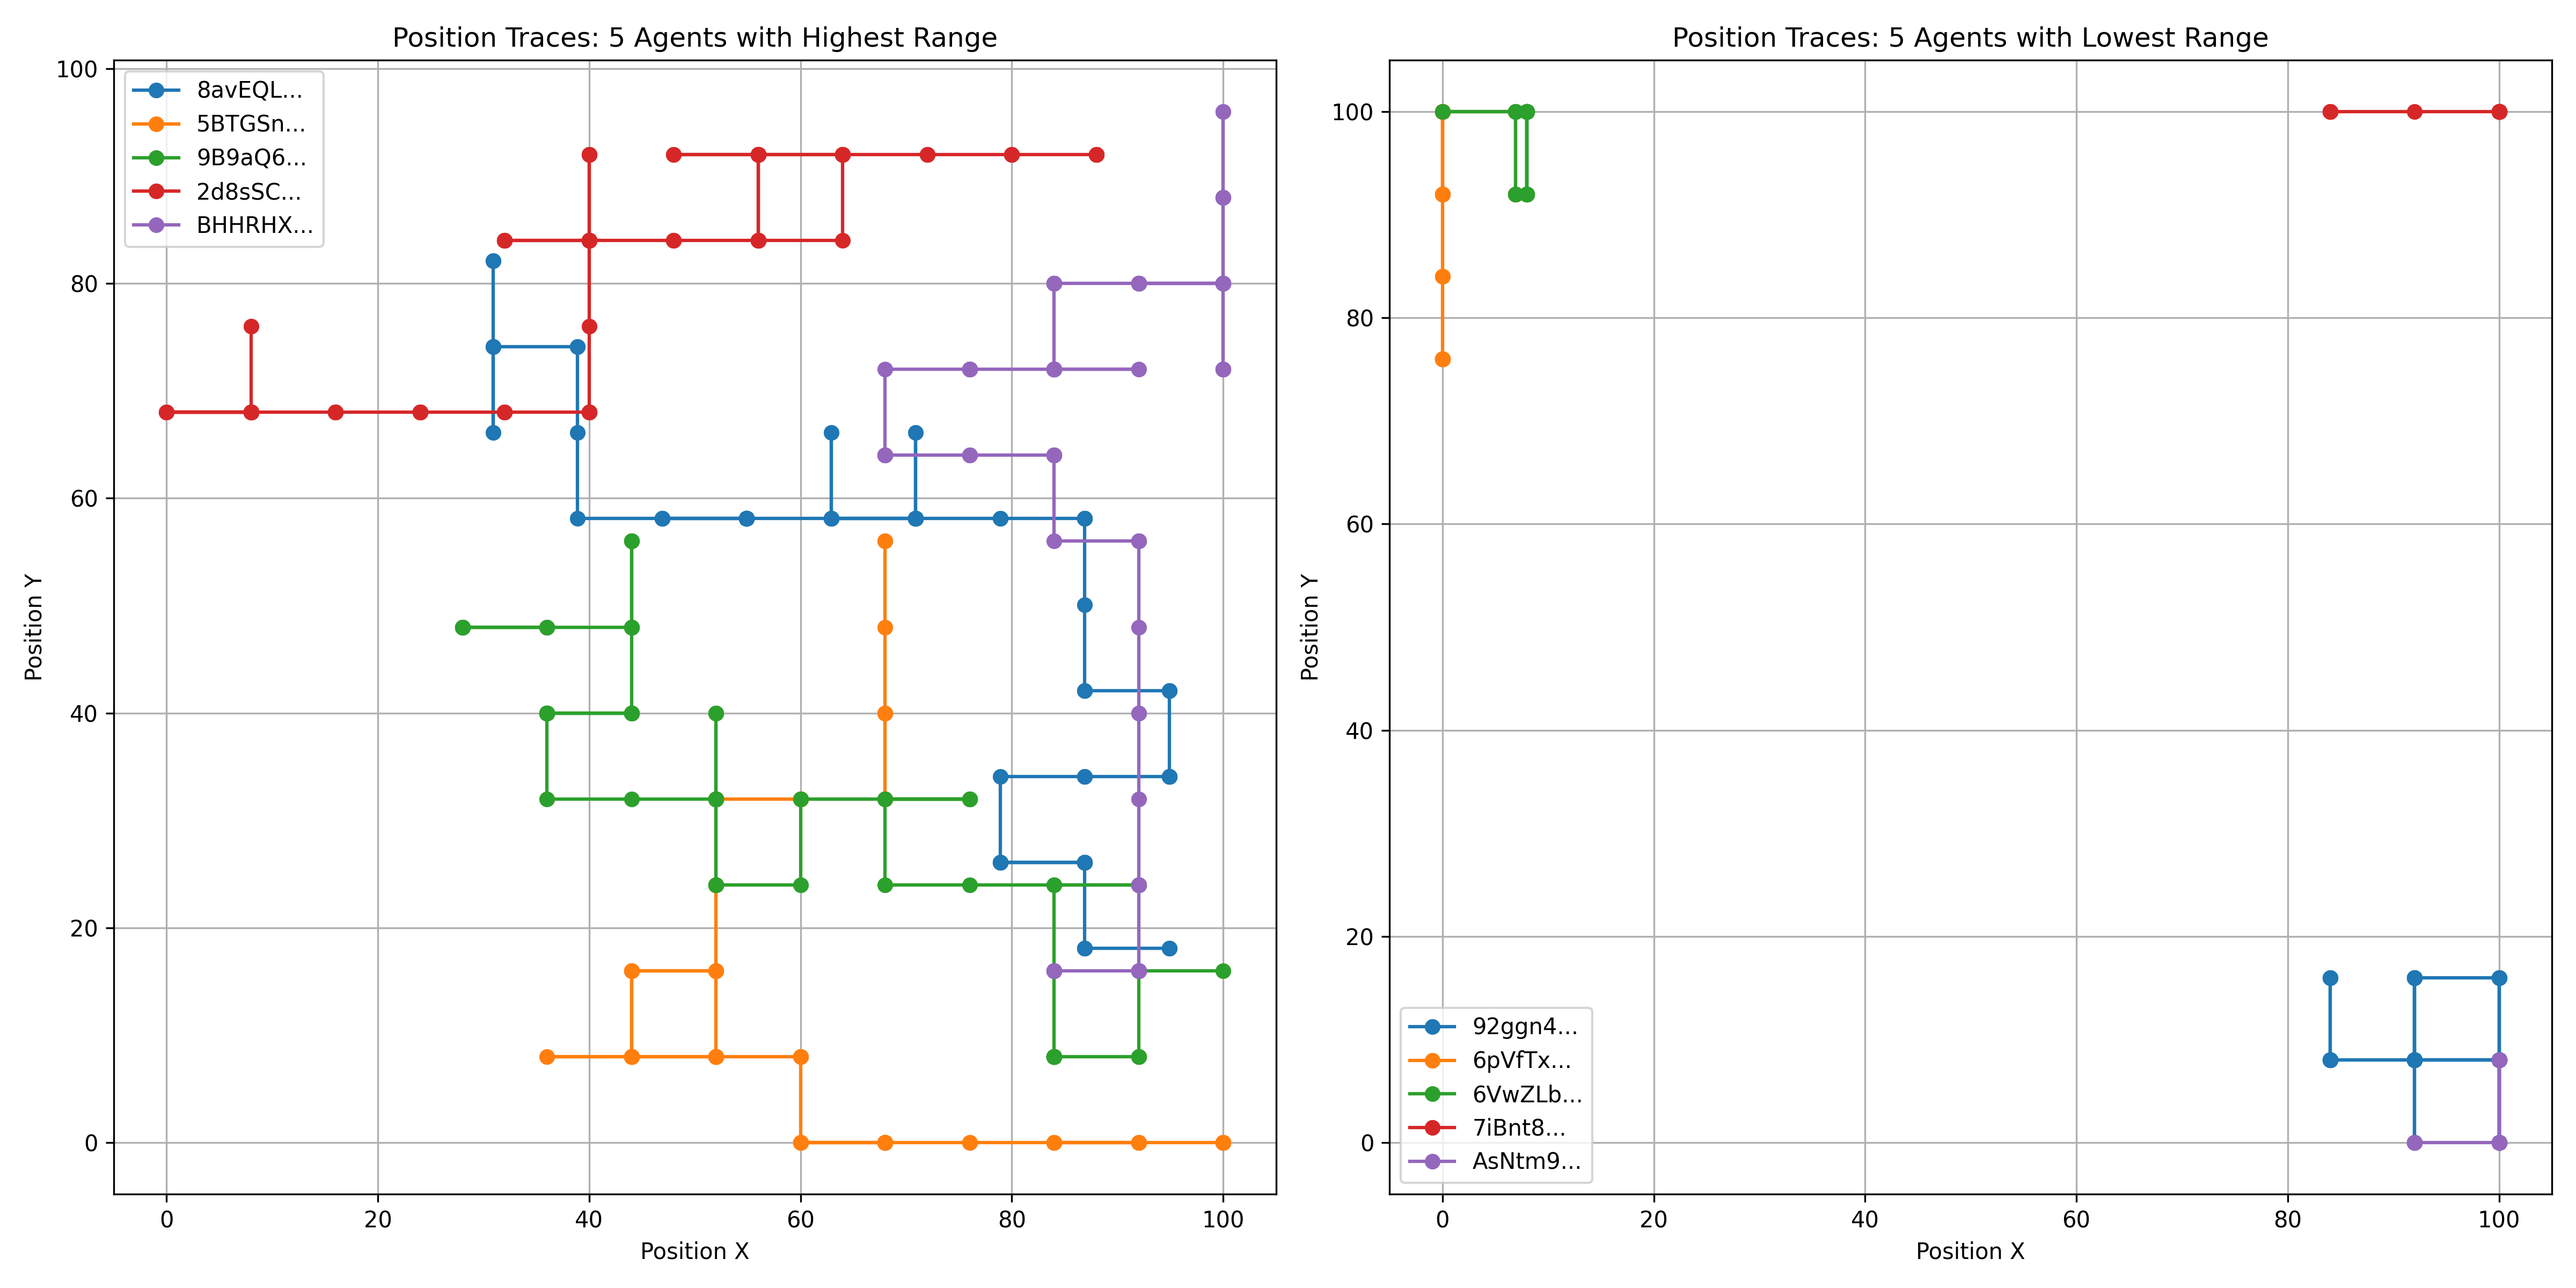
The left panel shows agents with high position ranges, indicating extensive exploration of the environment. The right panel shows agents with limited movement patterns. Notably, the agent with the widest embedding spread (in red on the left) traversed a much larger area of the environment than the more stationary agents.
Statistical Analysis
We compiled comprehensive statistics for each agent and compared their variable ranges:
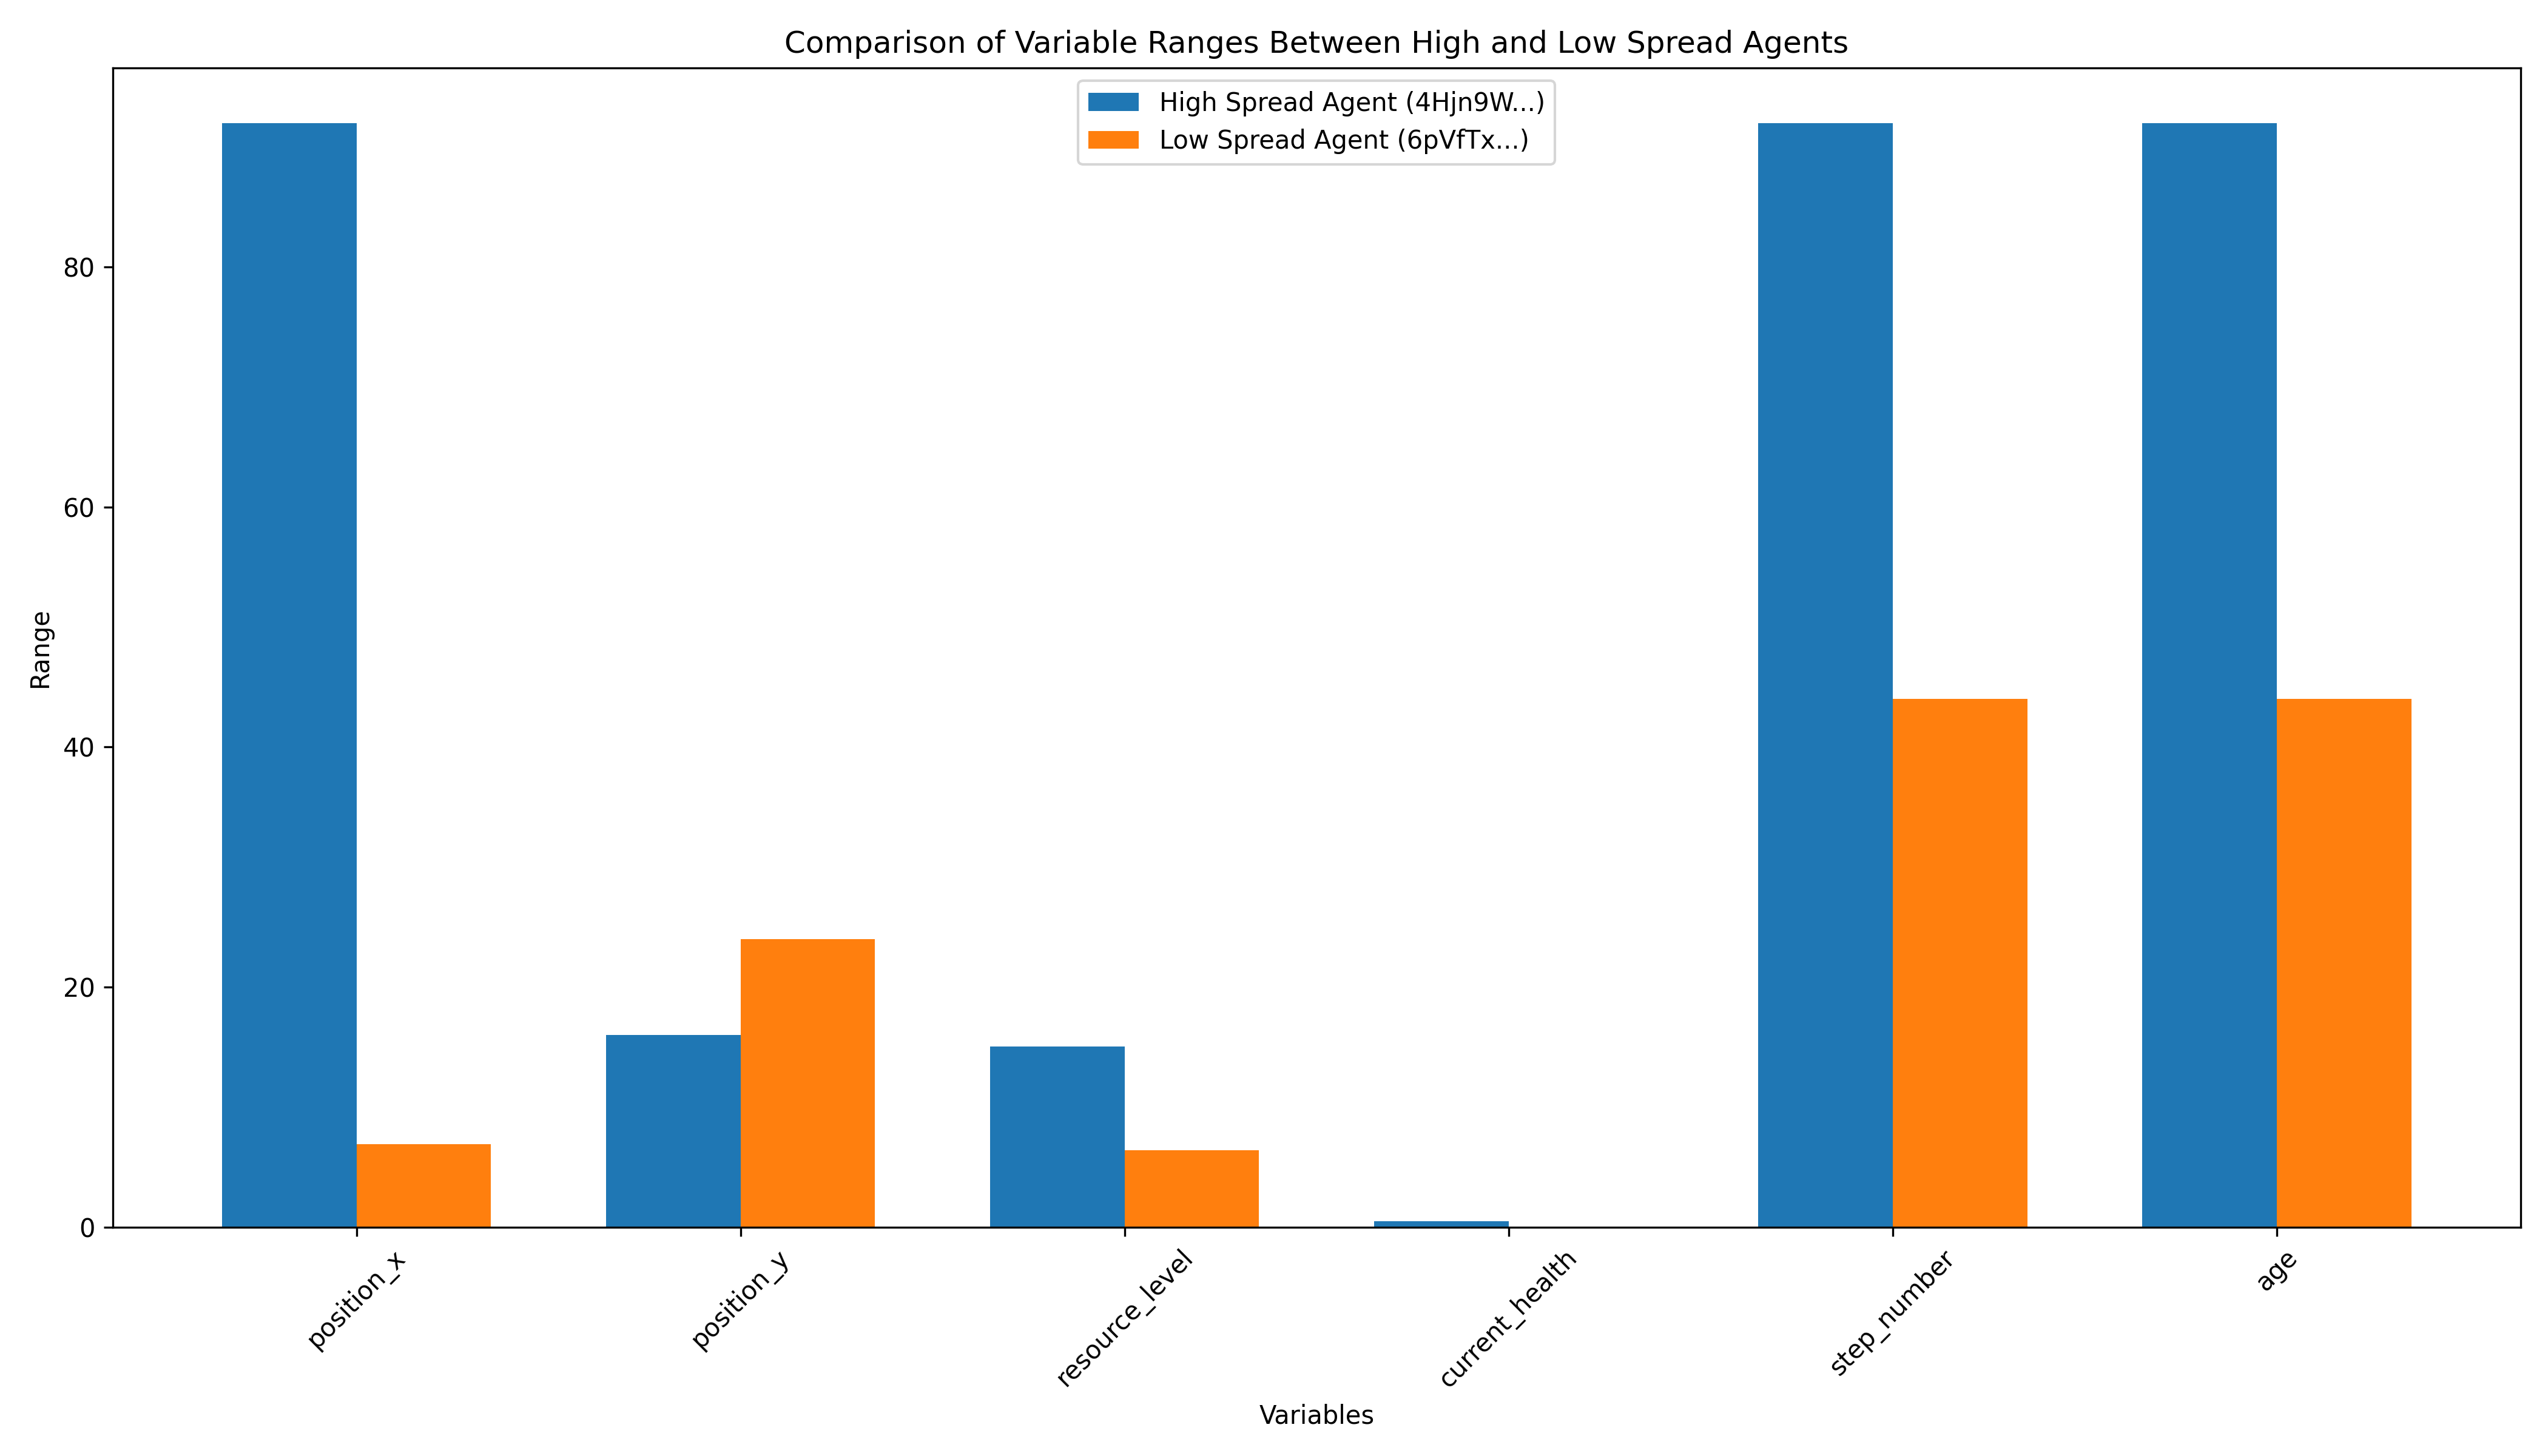
The analysis revealed that agents with wider embedding spread consistently exhibited:
Much higher position_x variability (up to 90 units compared to <10 units for low-spread agents)
Greater resource level fluctuations
Larger total distance traveled
More varied state transitions
Key Insights
This analysis led to several important insights:
Embeddings Reflect Experiential Diversity: The spread of an agent's embeddings directly correlates with the diversity of its experiences. Agents that explore more of their environment have more varied embedding representations.
Spatial Exploration Dominates: While multiple state variables contribute to the embeddings, spatial exploration (position_x and position_y variation) appears to be the dominant factor in determining embedding spread.
Agent Individuality: Each agent develops a characteristic pattern in embedding space that reflects its unique trajectory through the environment. This "signature" could potentially be used to identify agent strategies or behavioral patterns.
Embedding Quality Validation: The correlation between position distance and embedding similarity validates our embedding approach, confirming that the model captures meaningful relationships between agent states.
Implications and Applications
These findings have several significant implications:
For Multi-Agent Systems
Behavior Classification: Embedding patterns could be used to classify agent behaviors without prior labeling, potentially identifying exploration vs. exploitation strategies.
Anomaly Detection: Agents that deviate from expected embedding patterns might indicate bugs, exploitation of environment loopholes, or innovative strategies.
For Reinforcement Learning
Experience Diversity Measurement: Embedding spread provides a quantitative measure of exploration, which could be incorporated into reward functions to encourage diverse experiences.
Curriculum Learning: Agents could be trained to progressively increase their embedding diversity, ensuring thorough exploration before specialization.
For Simulation Design
Environment Assessment: Analyzing embedding patterns across multiple agents can reveal whether an environment provides sufficiently diverse experiences.
Simulation Validation: Embedding analysis can help identify if agents are truly exploring the full state space or getting stuck in suboptimal patterns.
Conclusion
Our analysis demonstrates that embedding agent states provides a powerful lens for understanding agent behavior and experience diversity. The visual and statistical patterns revealed through this approach offer insights that would be difficult to obtain through traditional metrics alone.
The finding that embedding spread correlates strongly with experiential diversity suggests that embedding techniques could serve as valuable tools for evaluating and improving agent-based systems. As agents become increasingly complex and autonomous, such techniques will be essential for understanding, debugging, and enhancing their behavior.
In future work, we plan to explore how these embedding patterns evolve over training time and how they might be leveraged to guide exploration strategies in reinforcement learning algorithms. The rich information contained in these embeddings promises to open new avenues for advancing our understanding of artificial agents and their relationship with their environments.
Technical Details
The analysis used the following tools and techniques:
Sentence-transformers with the "multi-qa-MiniLM-L6-cos-v1" model for creating embeddings
t-SNE for dimensionality reduction and visualization
SQLite for storing and retrieving agent state data
Python with pandas, numpy, and matplotlib for data analysis and visualization
This combination of techniques enabled us to transform raw agent state data into meaningful insights about agent behavior and experience diversity.